

- The Explorer on the left — the navigation tree of every concept in the ontology.
- The lineage canvas in the center — a visual graph of how your concepts and data sources depend on one another.
- The Concepts and Data tabs on the right — for browsing the concepts and data sources you can build with.
The Explorer
The Explorer is your ontology’s table of contents. Toggle it with the Explorer tab on the far-left edge. Each row is one concept; the icon shows its type:
A small green dot next to a concept means it has unsaved changes.
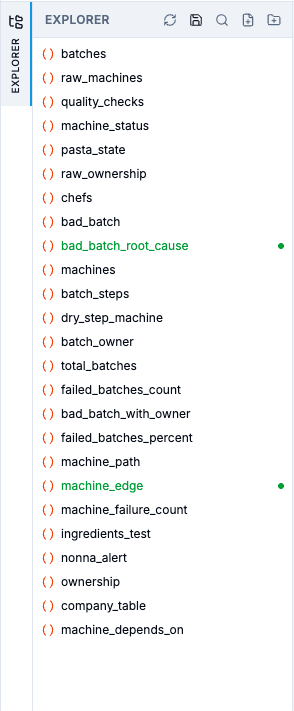
The Explorer tree — every concept in the ontology, with the header actions (refresh, save all, search, collapse/expand, new cell, new group) along the top.
Explorer header actions
Working with concepts in the tree
Concepts
The Concepts tab on the right edge lists every concept in the ontology (including those defined as schema nodes) as a browsable reference. Click the tab to open or close it; it has its own Search, Collapse all / Expand all, and Refresh controls. Each entry is expandable and shows the concept’s fields and types.- Click an entry to jump to its concept in the editor.
- Copy concept copies the concept’s signature —
name(field1, field2, …)— to your clipboard, ready to paste into a rule.
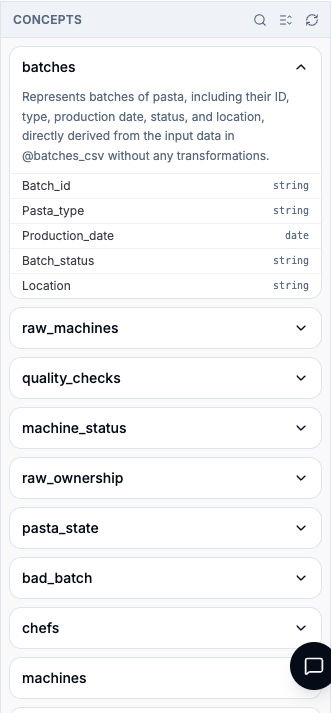
The Concepts tab — every concept in the ontology with its fields and types, each one expandable and ready to copy or jump to in the editor.
Data
The Data tab on the right edge lists the data sources connected to your workspace, grouped by location (for example Local Files and an S3 bucket). Each source shows its column count and expands to reveal its schema, row count, and path.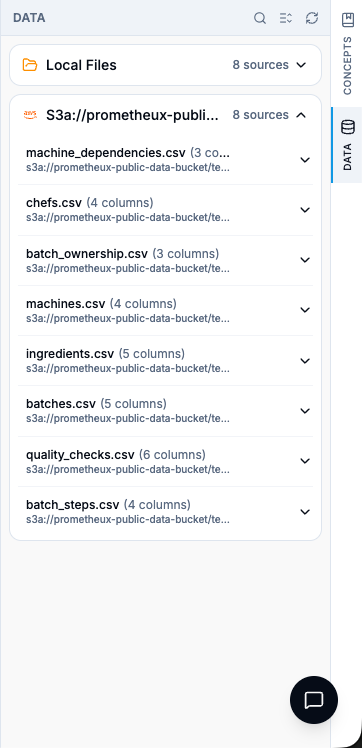
The Data tab — sources grouped by location (Local Files, S3), each showing its column count and expandable schema.
The lineage canvas
The center canvas draws your ontology as a dependency graph: each concept is a card, each data source is a node, and the edges show what feeds what — this is your data lineage at a glance.- Each concept card shows a status dot (running, success, error, or skipped), the concept name, and — if it has fields — an expand/collapse chevron.
- Click a card to open that concept in the editor and highlight its upstream dependencies.
- A card’s three-dot menu offers Rename and Delete.
- Click a data source node to open a side panel with two tabs: Details (connection info and schema) and Preview (a paginated, searchable sample of the data).
- Use Collapse all cards / Expand all cards to fold every card to its title, and the standard zoom / fit controls to navigate large graphs.
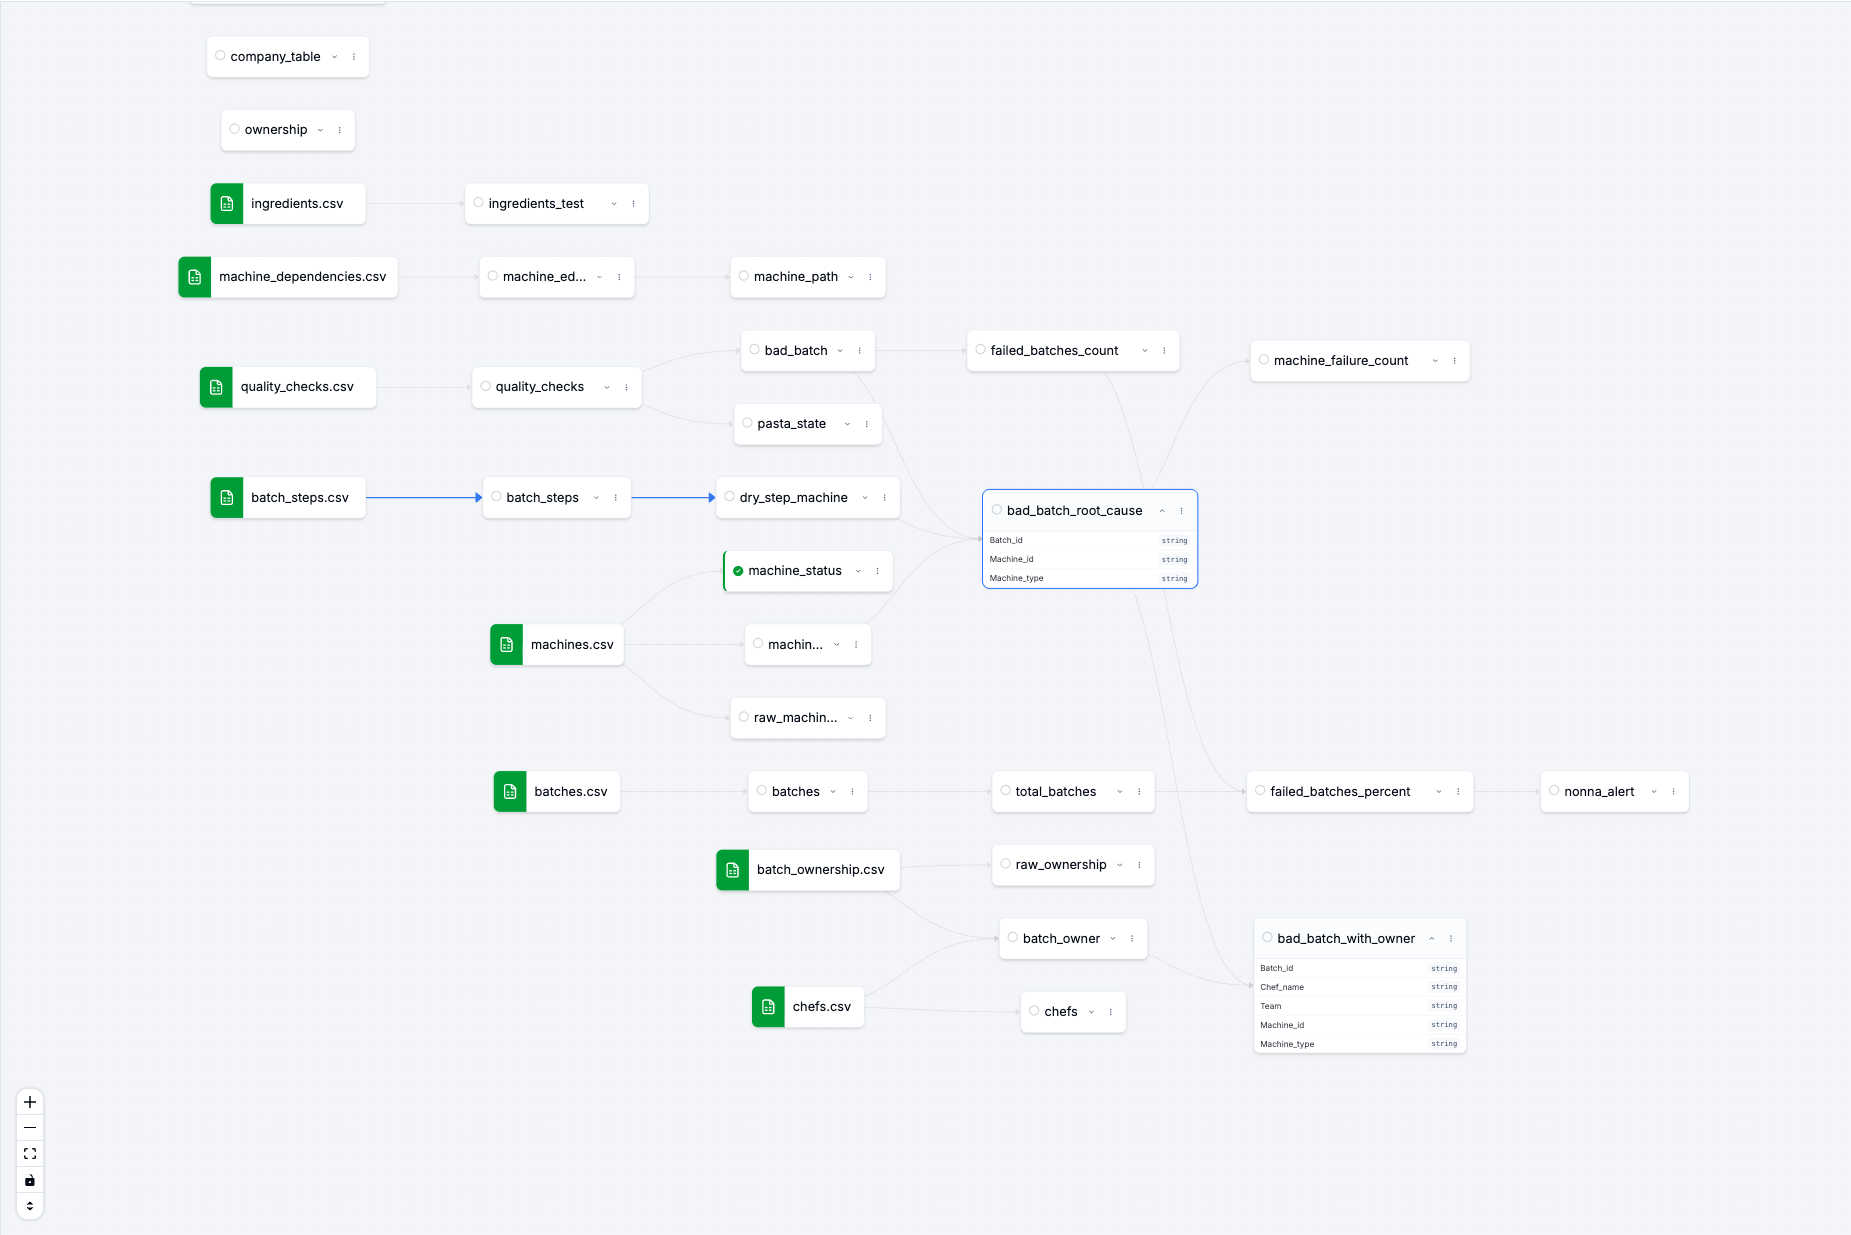
The lineage canvas — concept cards connected by dependency edges, each with a status dot, with a data source node feeding the chain.
Where to go next
The Concept Editor
Every control, tab, and keyboard shortcut in the editor.
Concepts & Lineage
The concepts behind the canvas, and how lineage is captured.
Data Sources
Connect the data that powers your concepts.
AI Assistant
Have the assistant build and run concepts for you.